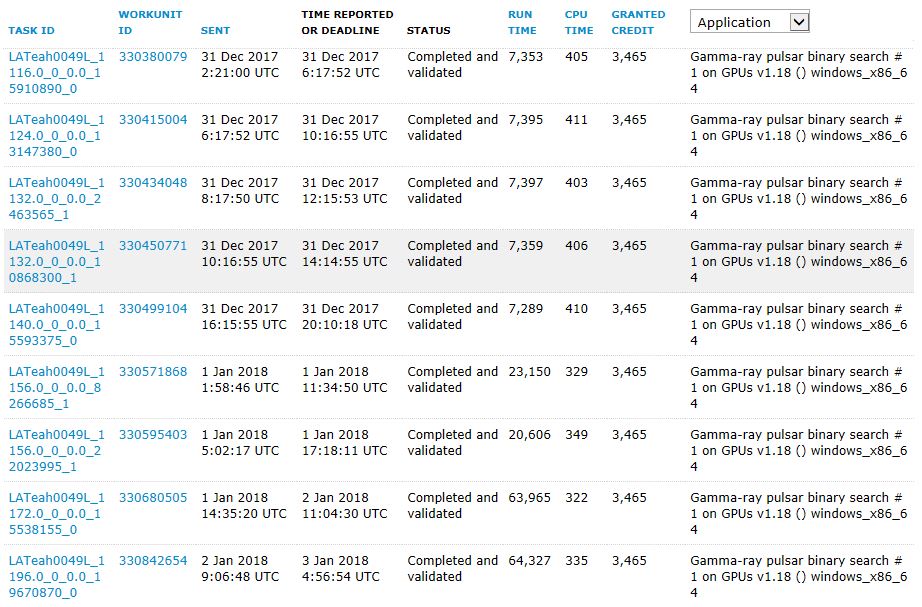
Why the calculation time is very different?
6 Jan 2018 16:31:51 UTC
Topic 212454
(moderation:

GPU:
AMD Radeon(TM) R5 240 (1024MB)

Language
Copyright © 2024 Einstein@Home. All rights reserved.

I am not familiar with AMD
)
I am not familiar with AMD GPU behavior in this respect, but some Nvidia GPUs downclock to a "safety mode" in some conditions, with an extreme reduction on power consumption and temperature, and a considerable increase in elapsed time. Recovery from this "safety mode" sometimes requires reboot, and sometimes requires even more (I almost scrapped a card I believed to be permanently downclocked, only to have it revive when I reinstalled something, or some such).
I hope a Radeon user can comment on whether something like this is plausible, and perhaps give wisdom on what conditions my switch you in to (and out of) the state.
Another possibility is a change in congestion on your host. Possibly other applications are sharing use of your GPU, your CPU, or both, and that the sharing properties were non-equivalent in the time range of interest. I currently only run application on my GPUs, but in the past I have seen particular pairings of dis-similar applications for which one of the two would get far more than a "fair share" of GPU attention.
Almost all the evidence is on your machine. This case is not a question of differences among the work units (all the units you show have the second field of the WU name in the range of 1116 to 1196, which would have closely equivalent work content). I suggest you review the sharing of GPU, the tasks running on the CPU, the clock rates (memory and core) of the GPU, the number of tasks simultaneously running the GPU, application diversity, and so on.
Good luck figuring it out.
I can't really add much more
)
I can't really add much more to what Archae86 has said. I have lots of AMD GPUs but nothing at the low end like an R5 240. I'm quite surprised it was able to do tasks in just over 2 hrs.
It's hard to know whether or not those you are showing are just the validated tasks. Perhaps you have excluded other types? It was interesting to see the sudden change in the evening of new year's day - almost as if you started something else that suddenly used your GPU for other purposes. It's also quite difficult to understand the next transition from ~20ksecs to ~60ksecs over subsequent days. Are there pending tasks mixed in the list as well that are not showing? Are there other quite different times as well? Your computers are hidden so I can't check for myself.
Because the times are so relatively constant at the three levels, it does look like some sort of throttling (reduction in frequency - core and/or memory) is going on.
Cheers,
Gary.
This host appears to have has
)
This host appears to have two GPUs, maybe that might explain the difference?
When I first looked, the
)
When I first looked, the computers were hidden, which I noted at the time.
The OP must have decided to change that. Because only the final 64K of data gets returned in stderr.txt, you can't actually see which tasks were done by which GPU as that info is at the start of the file which has been truncated. These files, as produced on a host, are much larger than 64K.
There seems to now be a group of tasks whose completion times are in the 30-40K range. There are no more completing around the 7K mark which (I would guess) seems to be far too slow for a GTX 1070 anyway, even if the concurrency was higher than 1. Surely a GTX 1070 would be able to complete tasks a lot less than 700 secs rather than 7K. I'm wondering if none of the tasks in the full list are being crunched by the 1070.
The OP needs to provide more information.
Cheers,
Gary.
GTX1070 did not run
)
GTX1070 did not run einstein@home.
Possible drivers have some
)
Possible drivers have some problems
freestman wrote:GTX1070 did
)
Was that your choice? If you allowed it to crunch, it should be very fast.
Cheers,
Gary.
freestman wrote:Possible
)
I don't know anything about Windows drivers. The fact that your card has crunched quite a number of tasks without error seems to indicate that the driver is OK. Without knowing what other things you use the machine for, it's hard to say what is causing the variation in crunch times.
What do you do with the GTX 1070?
Cheers,
Gary.
GTX1070 in the calculation
)
GTX1070 in the calculation project floding@home.
Your 1070 is probably
)
Your 1070 is probably grabbing all the PCIe bandwidth it can and may be causing the AMD card to struggle for resources. Perhaps you saw ~7K seconds when there was no competition for resources.
Cheers,
Gary.