The Einstein@Home Starsphere Screensaver
") (click to enlarge)The Einstein@Home Screensaver has a number of elements related to current efforts to detect gravitational radiation from periodic sources such as pulsars. The primary element of the screensaver is a rotating celestial sphere showing the known constellations, along with the current zenith positions of three gravity wave detectors. The positions of the detectors relative to the stars changes periodically over a 24 hour period. If you went to one of the detector sites, the stars visible directly overhead at any time are the same ones that appear next to the detector on your screensaver. (This assumes of course that your computer's time and timezone are correctly set!) Also shown are the positions of the known pulsars and supernovae remnants, and a marker indicating the positions being searched as the calculations proceed. When the graphics are shown in a separate window (not as a screensaver) the user can control the display with the mouse and keyboard.
(click to enlarge)The Einstein@Home Screensaver has a number of elements related to current efforts to detect gravitational radiation from periodic sources such as pulsars. The primary element of the screensaver is a rotating celestial sphere showing the known constellations, along with the current zenith positions of three gravity wave detectors. The positions of the detectors relative to the stars changes periodically over a 24 hour period. If you went to one of the detector sites, the stars visible directly overhead at any time are the same ones that appear next to the detector on your screensaver. (This assumes of course that your computer's time and timezone are correctly set!) Also shown are the positions of the known pulsars and supernovae remnants, and a marker indicating the positions being searched as the calculations proceed. When the graphics are shown in a separate window (not as a screensaver) the user can control the display with the mouse and keyboard.
Stars and Constellations
The rotating sphere shows the major stars of the constellations. You may have trouble at first recognizing some of the constellations; they will be backwards from what you are accustomed to because you are viewing them from outside the celestial sphere. You can use the mouse (as described below) to zoom to the inside of the celestial sphere, where the constellations will look like they normally do in the night sky.
Gravitational and Radio Wave Observatories
Each of the “L” shaped markers on the starsphere represents the current zenith position (point directly upward) for one of the instruments which collects the data analyzed by Einstein@Home. The “L” shape comes from the fact that the detectors are basically very large Michelson interferometers. The orientation of the detectors is correct, but they are not to scale.

LIGO Hanford Observatory (LHO)
Hanford, Washington, USA, (N 46.45°, W 119.41°)
Consisting of two interferometers, one with 4 km arm length (H1) and one with 2 km arm length (H2, decommissioned).

LIGO Livingston Observatory (LLO)
Livingston, Louisiana, USA, (N 30.56°, W 90.77°)
Consisting of one interferometer with 4k m arms (L1).

GEO600
Hanover, Germany, (N 52.24°, E 9.81°)
Consisting of one interferometer with 600 m arms.
VIRGO
Cascina, Italy, (N 43.63°, E 10.51°)
Consisting of one interferometer with 3 km arm length.

Arecibo Observatory
Arecibo, Puerto Rico, (N 18.34°, W 66.75°)
Radio telescope with a diameter of 305 m.
If you have set your system clock to the correct time then the instruments will be shown in the correct relationship to the stars on the celestial sphere. If you watch over the period of a day you will see that they move around the celestial sphere once in a period of 24 hours.
Pulsars and Supernovae Remnants (SNRs)
The purple dots represent the known pulsars, which have been detected electromagnetically. Notice that these are clustered in the plane of our galaxy (the Milky Way), predominantly toward the center of the galaxy. You may also notice two small clusters of pulsars in the celestial southern hemisphere. These pulsars are located in the Large or Small Magellanic Cloud.
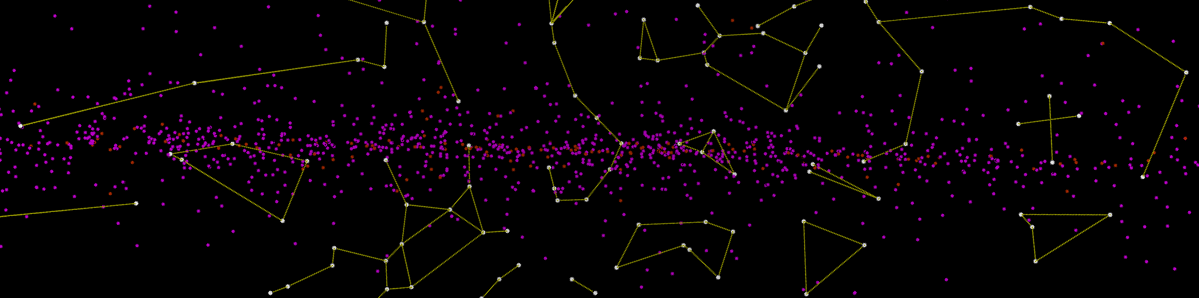
The dark red dots represent the known supernova remnants. These are also clustered toward the center of the galaxy. Supernovae remnants are of particular interest for gravity wave hunters because some of these supernovae may have left behind a pulsar or spinning neutron star which might produce periodic gravity waves.
Search Marker
 The orange marker shaped somewhat like a gun-sight represents the current position in the sky which is being searched. The location is also noted in the lower right corner in celestial coordinates (Right Ascension and Declination). You will see this marker move from point to point as the search progresses. Details on how we search for gravity waves coming from a particular source will be linked from here sometime in the future.
Power Spectrum

The bar chart is a unique feature of the radio pulsar searches we conduct. While data from the Arecibo or Parkes Radio Observatories are being analysed the bar chart shows a real-time plot of the current power spectrum. It shows the relative signal power across the frequency range, starting at the assumed fundamental frequency (blind search). When a frequency band lights up in bright white the signal strength is significant. The pattern on the left (fundamental frequency + harmonics) might therefore indicate a yet unknown pulsar!
Mouse and Keyboard Controls
When the graphics are displayed in a separate graphics window (rather than as a screensaver) you can control the display with the mouse and the keyboard:
- Mouse
- Rotate: left drag
- Zoom: right drag (up/down)
- Keyboard toggles (keys)
- Stars: S
- Constellations: C
- Observatories: O
- Pulsars: P
- Supernova remnants: R
- Global grid: G
- Search marker: M
- Axes: A
- Search information: I
- Logo: L